25 Jun 2020
On This Page
Normal distribution
25 Jun 2020
On This Page
- A normal distribution curve is a type of probability distribution for continuous random variables.
- Examples:
- The distribution of height
- The distribution of IQ
- Properties of normally distributed curve are as follows:
- It is symmetrical on both sides of its mean
- The mean lies at the middle of the curve.
Mean = Median = Mode - The total area under the curve is equal to
1(since it is probability density function)
- Probability density function for Normal distribution is:
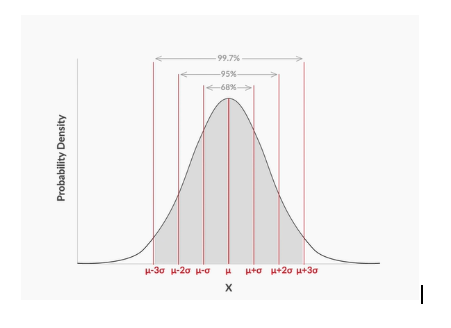
1-2-3 rule of normal distribution
- The area of the curve lying within
1standard deviation from the mean i.e between and is0.68 or 68%, - The probability of a continuous random variable that will lie within
1standard deviation from mean is0.68 or 68%, - The probability of a continuous random variable that will lie within
2standard deviation of the mean is0.95 or 95%, - The probability of a continuous random variable that will lie within
3standard deviation of the mean is0.997 or 99.7%. - Graph for the same above:
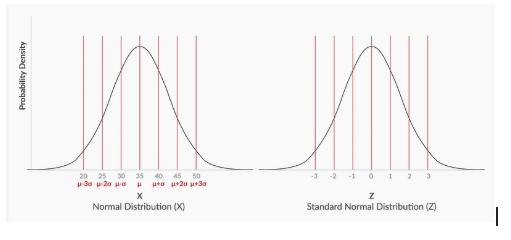
Standardized Normal distribution and Z-score
- Standardized Normal distribution is a special type of Normal distibution where and .
- The standardized normal distribution is used to compare between differnt normal distributions.
- A normal distribution can be converted into standardized normal distribution with the help of Z-score.
- For example, for a normal distribution with μ= 35 and σ = 5, the normal distribution curve and the standard normal distribution curve will look like this:
- Z-score can be used to:
- Calculate the probability of the occurence of a particular random variable
It is done with the help of Z-table. Excel can also be used with functionNORMDIST. - Compare normal distributions
Example: Suppose that the marks obtained by the students of a class are normally distributed.- In the mid-term exam, the mean score was 50 out of 100, and the standard deviation was 10;
- And in the end-term, the mean score was 60, and the standard deviation was 20.
A student Ram scored 70 in the mid-term exam and 72 in the end-term exam. In which exam was his relative performance better?
Soln: To answer above question, we can use Z-score to compare scores.- Z-score for Mid-term = (70 - 50)/10 = 2
- Z-score for End-term = (72 - 60)/20 = 0.6
Looking at the Z-scores, we can conclude that Ram’s relative performance was better in the mid-term exam compared to end-term exam.
- Calculate the probability of the occurence of a particular random variable