26 Jun 2020
On This Page
Inferential statistics
26 Jun 2020
On This Page
Terminology
- Population: Entire data
- Sample: Part of the population selected by a defined procedure to be representative of the data.
-
Variables used:
Term Sample Population Size n N Mean Standard Deviation s
Types of Sampling
- Random sampling: In this type of sampling, each element in the population has same probability of getting selected in the sample.
- Simple random sampling with replacement: In this, to select a sample of size n, you select an element from the population and then return it to the population. This procedure is repeated n times. Thus each element from the population can be selected multiple times. This method is used when population size is small.
- Simple random sampling without replacement: In this, to select a sample of size n, you select an element from the population and don’t return it to the population. This procedure is repeated n times. This method is used when population size is large.
- Stratified random sampling: In this, the population is divided into strata based on common characteristics. The elements are then selected from these strata.
- Cluster sampling: In this, the population is divided into clusters, and then, a simple random sample of these clusters is selected.
- Systematic sampling: In this, a starting point is selected in the population, and then, the elements are selected at regulat, fixed intervals.
- Non-random sampling: In this type of sampling, each element in the population doesn’t have same probablity of being selected in the sample.
- Convenience sampling: In this, the researchers selects the elements from the population on the basis of the convenient accessibility of these elements.
- Judgemental sampling: In this, the researcher selects the elements on the basis of his/her judgement and bias.
- Quota sampling: In this, the population is divided into groups or quotas, on the basis of which you select the sample. It is similar to Simple random sampling, except the quota is fixed in quota sampling. That is, you don’t consider the entire population, just a section of it to create a quota.
- Snowball sampling: In this, a small sample is first selected, say a sample of 5 people. Then, each of the five members can suggest five names and those five can suggest five more each. This creates a snowball effect.
Sampling distribution
It is the probability distribution of a particular sample statistic (such as mean) obtained by drawing all possible samples of size ‘n’ from the population and calculating their statistics.
Sampling distribution of sample mean
- If you draw a sample of size
nfrom a population, calculate the sample mean for all the samples and then draw the probability distribution for the random variable X (denotes the mean of the sample), the resulting probability distribution is called samping distribution of sample mean. - The mean of sample means is denoted by .
- The standard deviation of sample means is denoted by .
Central Limit Theorem
- It states that, when you draw a sampling distribution of the sample mean, where sample size is sufficiently large, the sampling distribution of sample mean will look like Normal distribution.
- Sample size ‘n’:
- For non-normally distributed, ‘n’ should be greater than or equal to 30.
- For normally distributed, ‘n’ can be of any size.
- Properties:
- Mean of sample means () = Mean of the population ()
- Standard deviation, , where n is the sample size
- The normal variate or the Z-score for the sampling distribution of a sample means is
Estimation
- The process of making inferences about a population using the information from its samples is known as Estimation.
- Types of Estimation:
- Point estimate: Here, a statistic obtained from the sample is used to estimate a population parameter. Its accuracy depend on how well the sample represents the population. The population parameters derived from sample statistics of various samples may vary. This is why interval estimate is preferred.
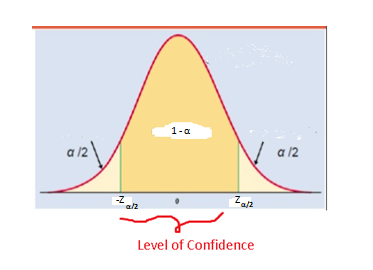
- Interval estimate: Here, the lower and upper limits of the values within which a population parameter will lie are estimated with a certain level of confidence.
- From above definition of Interval estimate, following equation can be derived:
Here, is the level of significance which is business dependent.
- The formula above is used to calculate the upper and the lower limits of for a certain level of confidence (a certain value of Z), where the value of is known. What if the value of is not known? In that case, you use the
t-distribution.
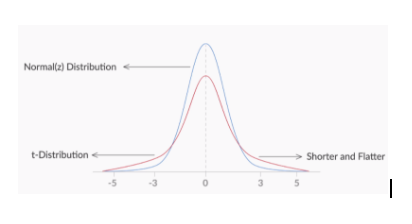
T-distribution
- It can only be applied when the samples are drawn from normally distributed population.
- It is flatter than a normal distribution.
- Degree of freedom = Sample size - Number of unknown parameters
Here, there is only one unknown parameter i.e. (Population standard deviation). So, the degree of freedom for a t-distribution is given byn - 1(n is the sample size) - Standard normal variate or test statistic for t-distribution = , where
sis the sample standard deviation - The formula to find the confidence interval is: